

Estimate Inflation: A Cautionary Tale
October 8, 2008
Commentary on The Art of Agile Development's Risk Management practice.
I liked my example of using risk management to make commitments, so I made a longer example that was pulled directly from many projects I've seen.
Unfortunately, I made it a little too real. There's scope creep, pushy stakeholders, and poor decisions. (The poor decisions are the killer.) It's a lousy example of risk management, but it's a great cautionary tale. I present: What Not To Do.
(If you haven't read my other essay yet, read it first.)
Prior to Iteration 1
The team has just been formed in order to work on an important new initiative for the company. They're experienced Agile practitioners, but they've never worked together before, so they don't know what their velocity is going to be. They start by playing the planning game, coming up with stories, and grouping them into minimum marketable features.
| Feature | Cost | Total |
|---|---|---|
| A | 34 | 34 |
| B | 7 | 41 |
| C | 13 | 54 |
| D | 2 | 56 |
| E | 6 | 62 |
| F | 26 | 88 |
| G | 17 | 105 |
| H | 9 | 114 |
| I | 11 | 125 |
| J | 5 | 130 |
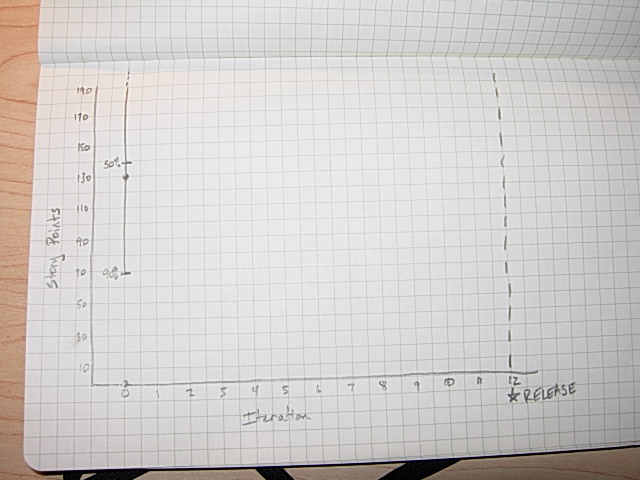
They also settle on a release date. It's 12 weeks from now. They don't know their velocity, but they take a guess by dividing their man-days by pi (8 devs × 5 days per iteration ÷ π). They get a velocity of 13.
Because their velocity is a wild-ass guess, they use the "risky" column in the risk table.
- 10%: 156 (13 velocity × 12 iterations ÷ 1 risk)
- 50%: 78 (13 velocity × 12 iterations ÷ 2 risk)
- 90%: 39 (13 velocity × 12 iterations ÷ 4 risk)
"We can commit to delivering feature A and we'll work on features B, C, D, and E as stretch goals."
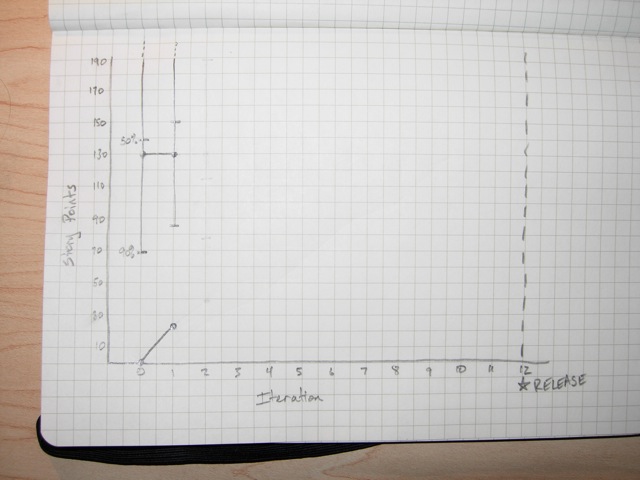
The on-site customers are quite unhappy with this result--they can't go to market unless features A, B, C, and D are done. They pressure the team to increase the estimate. Dividing by pi is ridiculous, they say; why should it take the team more than three days to do one day's worth of work? They say that the velocity should be 32 (8 devs × 5 days per iteration × 80% effectiveness). The team eventually splits the difference and predicts that the velocity will be 23.
- 10%: 276 (23 velocity × 12 iterations ÷ 1 risk)
- 50%: 138 (23 velocity × 12 iterations ÷ 2 risk)
- 90%: 69 (23 velocity × 12 iterations ÷ 4 risk)
"We're not comfortable with the velocity estimate, but if it's accurate we can commit to delivering features A, B, C, D, and E. The remaining features will be our stretch goal."
The best thing the team could have done was to delay making estimates; they have zero data and nothing to make commitments with. But customers demand estimates. It's a tricky situation, but I would have tried to get the customers to wait.
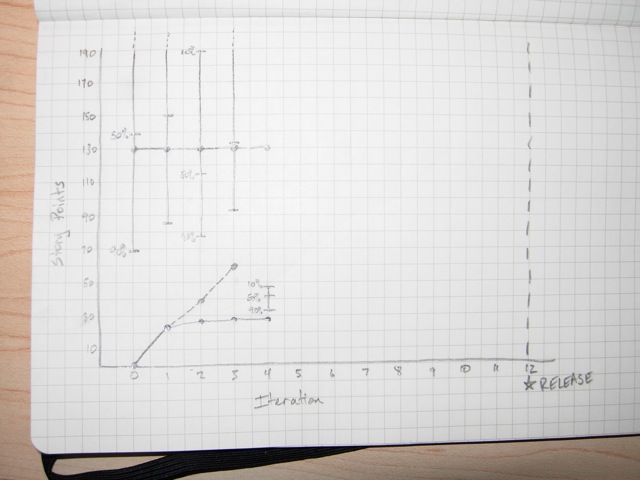
Iteration 1
The team makes makes a commitment to deliver 23 story points in the first iteration, and they do. Everyone is impressed, although a few people are concerned that things didn't really get done.
- 10%: 276 (23 finished + 23 velocity × 11 iterations ÷ 1 risk)
- 50%: 150 (23 finished + 23 velocity × 11 iterations ÷ 2 risk)
- 90%: 86 (23 finished + 23 velocity × 11 iterations ÷ 4 risk)
Iteration 2
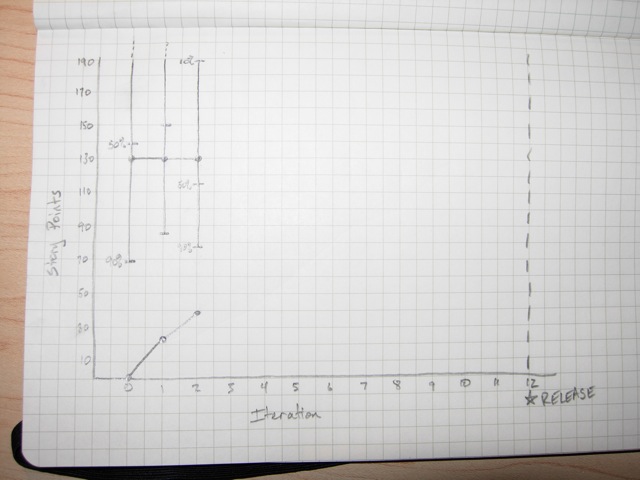
The next iteration is a disaster. There's a bit of work to finish up from iteration 1, and those take longer than expected. They keep finding bugs. They don't even start half of the stories that they planned on for this iteration, and they only finish one. That one story gives them a velocity of two.
- 10%: 45 (25 finished + 2 velocity × 10 iterations ÷ 1 risk)
- 50%: 35 (25 finished + 2 velocity × 10 iterations ÷ 2 risk)
- 90%: 30 (25 finished + 2 velocity × 10 iterations ÷ 4 risk)
A few people argue that two is a ridiculous velocity. They should at least count the stories that were partially done. After some arguing about how much of those stories were done, and how much work they did on the stories from iteration 1, they decide on a velocity of 15.
- 10%: 188 (38 finished + 15 velocity × 10 iterations ÷ 1 risk)
- 50%: 113 (38 finished + 15 velocity × 10 iterations ÷ 2 risk)
- 90%: 76 (38 finished + 15 velocity × 10 iterations ÷ 4 risk)
The team is falling into a classic trap here: they don't like the projections, so they're making up numbers that they do like. This is leading them to overcommit and do shoddy work that has to be revisited. It's gonna bite 'em in the ass... it always does.
Iteration 3
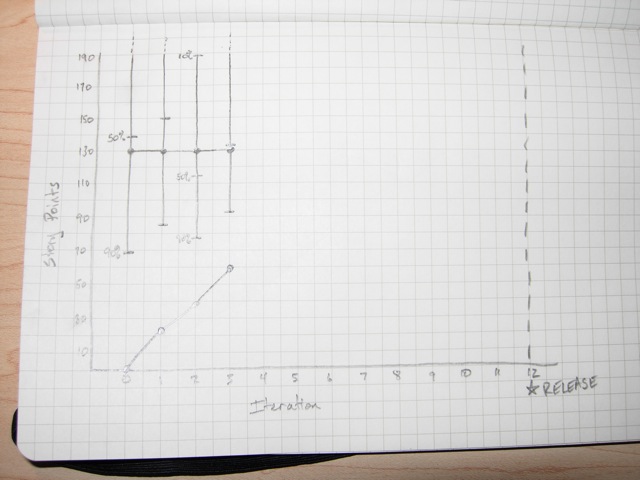
The problems continue. The team signs up for 15 points of new stories, but they have to work on the partially-finished stories from iteration 2 as well. They only finish one new story (worth three points), but they decide that their velocity was 17 because they finished all the stories from iteration 2 and partially finished all of the stories from iteration 3.
- 10%: 208 (55 finished + 17 velocity × 9 iterations ÷ 1 risk)
- 50%: 132 (55 finished + 17 velocity × 9 iterations ÷ 2 risk)
- 90%: 93 (55 finished + 17 velocity × 9 iterations ÷ 4 risk)
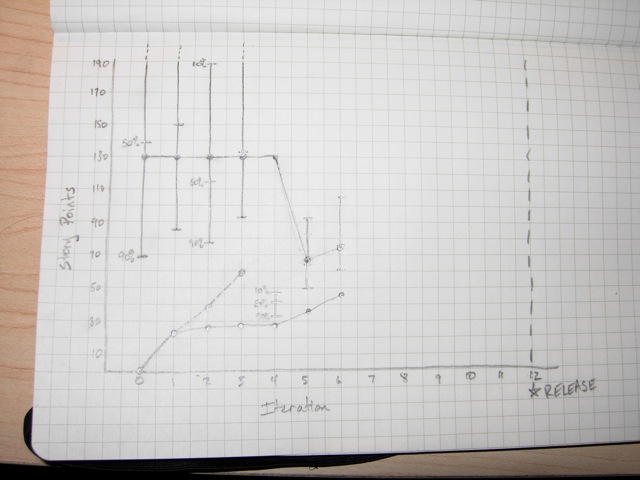
Iteration 4
The problems have finally become too significant for the team to ignore. They don't get any new stories completely done this iteration because they spent all of their time finishing stories from previous iterations. If they've really done as much as they say they have, they should be halfway done by now... but they haven't even finished feature A.
The team goes back to the original stories and estimates and discovers that they've really only finished 28 points. They've been double-counting stories because they've been spreading the work out over multiple iterations. If they only count stories they start and completely finish in a single iteration, their velocity over the last three iterations has been 2, 3, and 0.
It's an "oh shit" moment for everyone. They decide to quit gaming the system. They reset their velocity to 2 and make a renewed commitment to only signing up for what they can get "done done" every iteration.
- 10%: 44 (28 finished + 2 velocity × 8 iterations ÷ 1 risk)
- 50%: 36 (28 finished + 2 velocity × 8 iterations ÷ 2 risk)
- 90%: 32 (28 finished + 2 velocity × 8 iterations ÷ 4 risk)
The numbers look terrible, and it tests the team's newly-found resolve. They decide to warn stakeholders that something is going wrong, but not share the new numbers until they've had a few more iterations. "We've discovered a problem with our estimating approach and we probably won't be able to complete as many features as we thought," they say. "We'll have more information for you in two weeks, at the end of iteration 6."
Iteration 5
The team holds true to their promise not to do anything that they can't get to "done done". They make sure all the existing stories are done and do some new stories, too. They finish 8 points of new stories.
- 10%: 92 (36 finished + 8 velocity × 7 iterations ÷ 1 risk)
- 50%: 64 (36 finished + 8 velocity × 7 iterations ÷ 2 risk)
- 90%: 50 (36 finished + 8 velocity × 7 iterations ÷ 4 risk)
| Feature | Cost | Total |
|---|---|---|
| A | 45 | 45 |
| B | 7 | 52 |
| C | 13 | 65 |
| D | 2 | 67 |
| E | 6 | 73 |
| F | 26 | 99 |
| G | 17 | 116 |
| H | 9 | 125 |
| I | 11 | 136 |
| J | 5 | 141 |
The customers are busy, too. They take a hard look at what's been done and realize that feature A needs some more polish. They add 11 more points of stories to feature A.
They look at the results and say, "With the data we have right now, we can commit to delivering feature A and we can work on features B and C as a stretch goal." The on-site customers are worried--they need features A, B, C, and D to go to market. They reset their plan to include just features A, B, C, and D and start thinking about what to tell management next iteration.
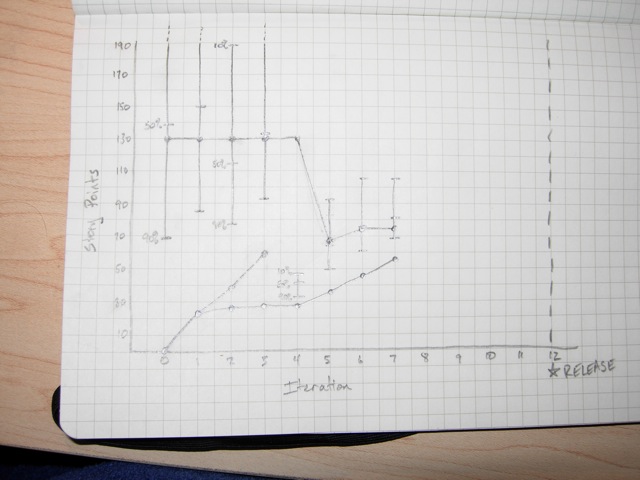
Iteration 6
Great news! The team finished feature A and has started on feature B. The customers thought about adding a few more stories to feature A, but decided that there's too much risk of not going to market. They're constraining scope until they know more.
The other good news is that the team has finally cleared out the partially-done work. They were able to spend the entire iteration focused on this iteration's stories, and as a consequence, their velocity went up! Their new velocity is 10.
- 10%: 106 (46 finished + 10 velocity × 6 iterations ÷ 1 risk)
- 50%: 76 (46 finished + 10 velocity × 6 iterations ÷ 2 risk)
- 90%: 61 (46 finished + 10 velocity × 6 iterations ÷ 4 risk)
| Feature | Cost | Total | |
|---|---|---|---|
| A | 45 | 45 | Done! |
| B | 9 | 54 | |
| C | 17 | 71 | |
| D | 4 | 75 | |
| E | 6 | 81 | |
| F | 26 | 107 | |
| G | 17 | 124 | |
| H | 9 | 133 | |
| I | 11 | 144 | |
| J | 5 | 149 |
It's not all good news, though. The customers look at features B, C, and D and realize that they're going to have to make some changes. They do their best to keep the changes small, but the scope still increases.
The team has an uncomfortable conversation with their stakeholders. "We made some mistakes in the beginning--we were too aggressive in our estimates, and that caused us to overlook some serious problems. We've corrected the situation, but we're still recovering. The good news is that we've finished feature A and we're committed to delivering feature B. We're working on features C and D as a stretch goal for the end of iteration 12. Because we can't go to market without C and D, we might have to ship later than we wanted. We'll keep you informed, and we won't make the same mistake again."
Iteration 7
The team continues to make good progress, completing 10 more points of stories, including feature B! They're also cleaning up some of the design flaws that the first few iterations introduced into the codebase. The programmers are starting to feel like things are under control.
- 10%: 106 (56 finished + 10 velocity × 5 iterations ÷ 1 risk)
- 50%: 81 (56 finished + 10 velocity × 5 iterations ÷ 2 risk)
- 90%: 69 (56 finished + 10 velocity × 5 iterations ÷ 4 risk)
"We've finished feature B and we're on track to delivering features C and D. If next week goes well, we may be able to eliminate the risk of shipping late."
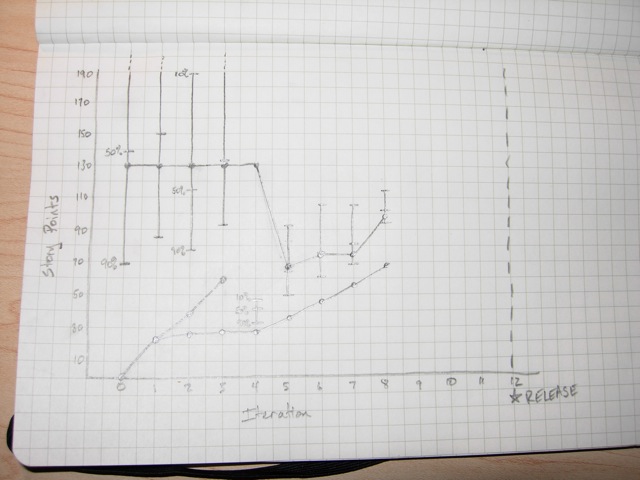
Iteration 8
Another great iteration. The team's velocity actually goes up, to 12. They've had four solid iterations and the programmers are feeling confident in their ability to get things "done done". The team decides that they're ready to move to the "rigorous" column of the risk table. This does wonderful things for their projections.
- 10%: 116 (68 finished + 12 velocity × 4 iterations ÷ 1 risk)
- 50%: 102 (68 finished + 12 velocity × 4 iterations ÷ 1.4 risk)
- 90%: 95 (68 finished + 12 velocity × 4 iterations ÷ 1.8 risk)
"We're happy to report that we can now commit to delivering features C and D on time. We're committing to shipping as scheduled. We're also ready to commit to shipping feature E and we'll work on feature F as a stretch goal."
Iteration 9
| Feature | Cost | Total | |
|---|---|---|---|
| A | 45 | 45 | Done! |
| B | 9 | 54 | Done! |
| C | 17 | 71 | Done! |
| D | 4 | 75 | Done! |
| E | 6 | 81 | Done! |
| K | 13 | 94 | (new) |
| Polish | 15 | 109 | (new) |
| F | 26 | 135 | |
| G | 17 | 152 | |
| H | 9 | 161 | |
| I | 11 | 172 | |
| J | 5 | 177 |
The team's velocity continues to go up, to 14. They finish features C, D, and E. The on-site customers have been demonstrating the product to users, though, and they discover that they're missing some features that end users need. They also identify some further polish to features A, B, C, D, and E that's necessary to wow the market.
- 10%: 124 (82 finished + 14 velocity × 3 iterations ÷ 1 risk)
- 50%: 112 (82 finished + 14 velocity × 3 iterations ÷ 1.4 risk)
- 90%: 105 (82 finished + 14 velocity × 3 iterations ÷ 1.8 risk)
"We've finished features C, D, and E. They'll be in the release next month. Our market research has also revealed a new feature, feature K, that's important for this release, so we're committing to putting that in. We've also identified some additional polish and tweaks that will make our users happier, so we're working on those as a stretch goal."
Iteration 10
The team is on fire! Their velocity goes up again, to 16. They finish feature K and start working on the polish. The customers go out on a limb and add feature F back into the schedule, although it's not supported by the projections... but they mitigate the risk by looking at how they can cut scope if they need to.
- 10%: 130 (98 finished + 16 velocity × 2 iterations ÷ 1 risk)
- 50%: 121 (98 finished + 16 velocity × 2 iterations ÷ 1.4 risk)
- 90%: 116 (98 finished + 16 velocity × 2 iterations ÷ 1.8 risk)
"We've finished feature K and we're committed to finishing the additional release polish. It looks like we'll have some extra time, so we're going to put feature F in as a stretch goal--we might have to cut parts of it, but we know what to cut if we do."
Iteration 11
The team's velocity is 16 again and they finish the release polish. They're doing a great job of keeping the code clean, including slack in each iteration, and getting everything to "done done," so they can sustain that velocity indefinitely. The customers are a little disappointed that the velocity didn't keep going up, but they cut scope on feature F as planned.
- 10%: 130 (114 finished + 16 velocity × 2 iterations ÷ 1 risk)
- 50%: 125 (114 finished + 16 velocity × 2 iterations ÷ 1.4 risk)
- 90%: 123 (114 finished + 16 velocity × 2 iterations ÷ 1.8 risk)
"Everything's on track. We're going to have a great release next week."
Iteration 12
Another good iteration. The team finishes 16 points of work and the customers adjust scope to match. They perform their release (using their automated script, of course) and spend the following week documenting their work, conducting a retrospective, learning from their experience, and having a well-earned party.
Analysis
This was a made-up example, but it's based on the real experiences of teams I've worked with. I often see teams that are struggling because they overcommit each iteration. As a result, they have trouble meeting their commitments and--ironically--have much lower performance than they should.
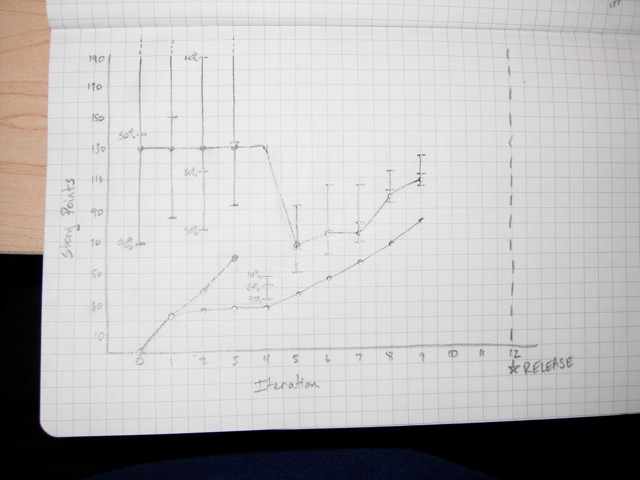
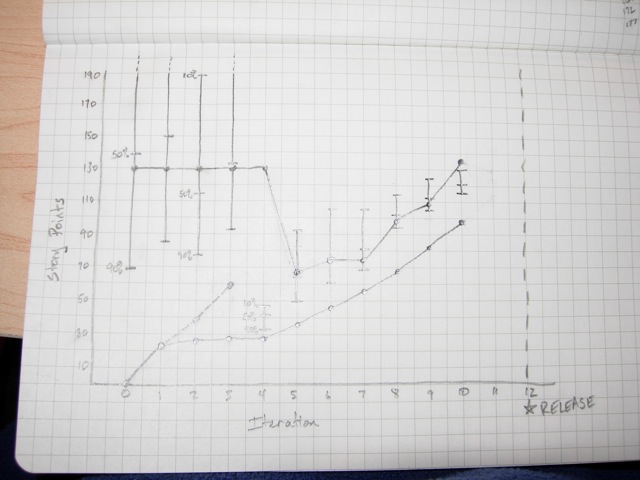
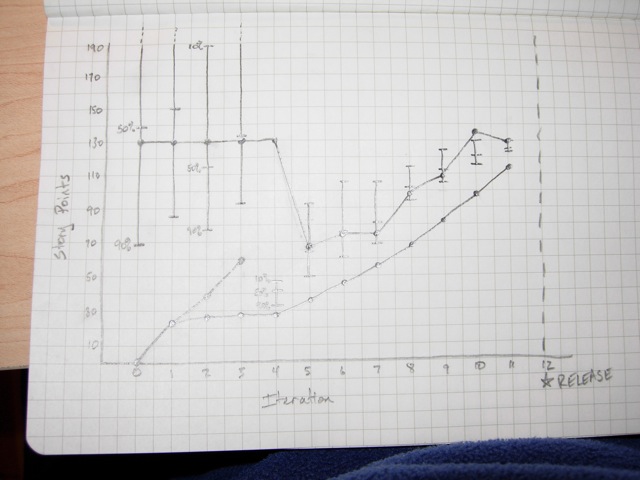
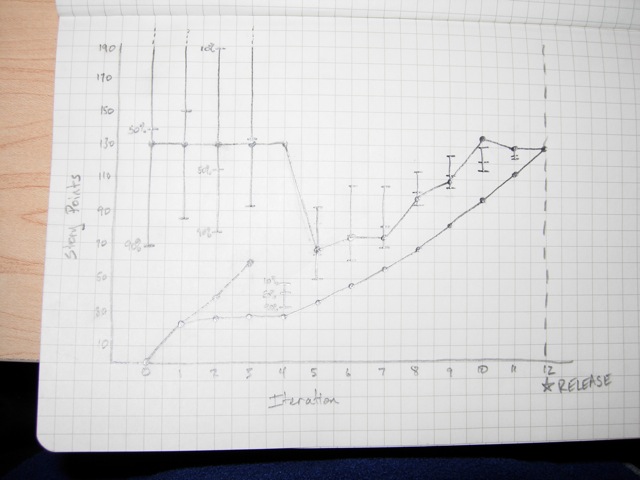
In the end, this team delivered 130 points of work, which was (purely coincidentally) the same amount they originally planned. But they only did that well because they backed off of their aggressive, made-up estimates and let the team do their work properly. You can see in iterations 2-4 how badly the team's real velocity dropped off. Once the poor iteration planning was fixed, the team's velocity improved, and steadily rose to its optimum value of 16*... a value they could have reached much earlier if they hadn't wasted so much effort on trying to meet unrealistic commitments.
*Optimum for this team, that is. Every team's optimum velocity is different.
When I work with teams like this one, the first thing I do is help them learn how to deliver on time every iteration. This almost always involves reducing the team's velocity to what they can actually accomplish. This takes the pressure off the team and allows them to do the important clean-up work that they've been postponing. The result? Their velocity steadily improves as they clear out the damage.
The team in this example was lucky in that they discovered and fixed the problem themselves. Most teams have trouble taking the drastic action they need. As a result, their velocity never stabilizes. They struggle to make accurate predictions and the constant pressure causes the team to make dumb mistakes. They don't deliver on their commitments.
You can avoid this mistake by only committing to what you actually deliver. Only count stories that are totally, 100%, "done done". You'll be happier, you'll get more done, and you'll be able to make meaningful projections and commitments.