

Use Risk Management to Make Solid Commitments
October 7, 2008
Commentary on The Art of Agile Development's Risk Management practice.
Making and meeting commitments. Over and over, when I ask executives what they want from their teams, I've found this to be one of the top priorities.
That's why the Risk Management practice in The Art of Agile Development is one of my favorites. It's all about being able to make and meet commitments, and we have three great tools in there: risk multipliers, risk-adjusted burn-up charts, and project-specific risks. Today, I'll show you how to use the first two to make solid commitments to your executives.
Risk Multipliers
Risk multipliers account for common risks, such as turnover, changing requirements, work disruption, and so forth. These risk multipliers allow you to set a date, estimate how many story points of work you'll get done, and be right. It's a simpler version of the risk curves you'll see in good books on estimating and project management.
| Risk Multiplier | |||
|---|---|---|---|
| Chance | Rigorous Process | Risky Process | Description |
| 10% | 1 | 1 | Ignore--almost impossible |
| 50% | 1.4 | 2 | Stretch goal--50/50 chance |
| 90% | 1.8 | 4 | Commitment--virtually certain |
(As we explain in the book, these multipliers are estimates gleaned from DeMarco & Lister's RISKOLOGY simulator and Todd Little's detailed analysis of hundreds of projects. I'm guessing somewhat at how accurately they apply to XP. The most accurate approach is to calculate your own risk multipliers from past project history, but most companies don't track that data.)
The way this works is that you take your iteration velocity and extrapolate out to your delivery date. That's the best estimate of how many story points you'll finish under ideal circumstances. So if your velocity is 14 and you have ten iterations left, you predict that you'll finish 140 more story points before you release.
Then you apply the risk multipliers according to the type of process you're using. If you have a solid velocity and get everything "done done" every iteration, you get to use the "rigorous" column. Otherwise, you use the "risky" column.
To continue the example, let's say your team has a rigorous approach. To make a commitment, you apply the multipliers, like this:
| Chance | Story Points Finished | Description |
|---|---|---|
| 10% | 140 (140 ÷ 1) | Ignore--almost impossible |
| 50% | 100 (140 ÷ 1.4) | Stretch goal--50/50 chance |
| 90% | 78 (140 ÷ 1.8) | Commitment--virtually certain |
This allows you to make commitments to stakeholders and executives. "We are virtually certain to finish 78 more points by our release date, so we're committing to delivering features A, B, and C. We have a 50-50 chance of completing 100 points, so we're planning on features X, Y, and Z as a stretch goal."
The Risk-Adjusted Burn-Up Chart
The risk-adjusted burn-up chart allows you to track your commitments alongside your progress. It's based on Phil Goodwin's burn-up chart, which is a variant of Scrum's burn-down chart. Here's how it works.
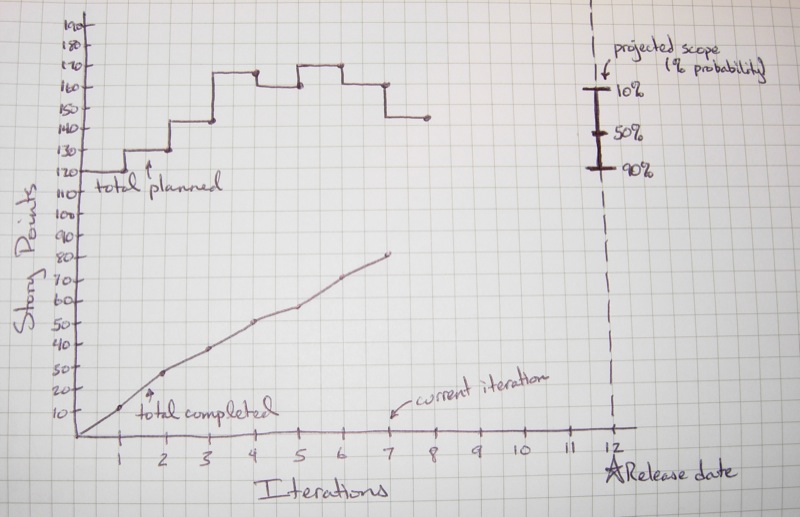
Start by drawing a chart with iterations on the bottom and story points on the left. Mark the release date with a dashed line, as shown.
At the start of every iteration (typically, every week), plot two points on the chart. At the bottom of the chart, plot the number of story points that are "done done". At the top of the chart, plot the total story points--"done done" plus the number remaining in the plan. This gives you a standard burn-up chart.
Now add the risk numbers. Calculate your probability of completing various numbers of story points using the risk multiplier approach described in the previous section, and then plot those numbers on a vertical line. You can either draw the vertical line on the release date and change it every week (as shown in the figure above), or you can draw it on the current iteration (as I'll show in a moment).
The result is an information-rich chart that shows you three trends:
- Completion progress;
- Changes to the plan; and
- What you can commit to.
Example
Here's an extended example of these ideas in practice. Imagine a team of six programmers. They've been working together for a while now and have a solid velocity of 12. They start a new project that's due in six weeks. After playing the planning game, they have a prioritized list of minimum marketable features that looks like this:
| Feature | Cost | Total |
|---|---|---|
| A | 34 | 34 |
| B | 7 | 41 |
| C | 13 | 54 |
| D | 2 | 56 |
| E | 6 | 62 |
| F | 26 | 88 |
Based on their past velocity of 12 and their history of getting iterations "done done," the team calculates the following estimates:
- 10%: 72 (12 velocity × 6 iterations ÷ 1 risk)
- 50%: 51 (12 velocity × 6 iterations ÷ 1.4 risk)
- 90%: 40 (12 velocity × 6 iterations ÷ 1.8 risk)
They report this to their stakeholders by saying, "We commit to delivering features A and B, and we'll work on feature C as a stretch goal. Features D and E are unlikely to make it, and we almost certainly won't have time to do feature F."
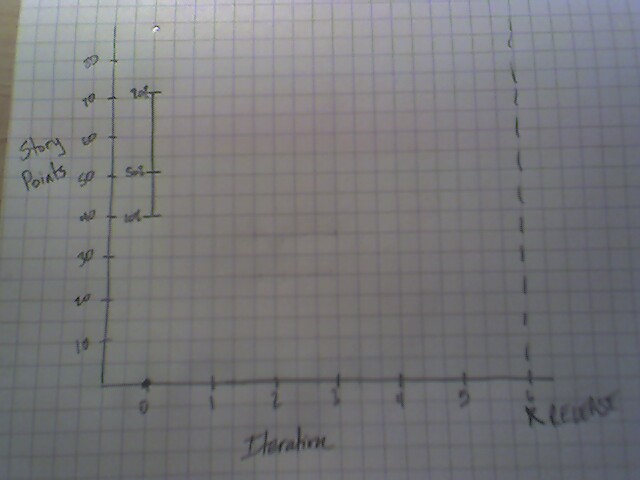
(Sorry about the image quality. Also, the 10% and 90% should be reversed.)
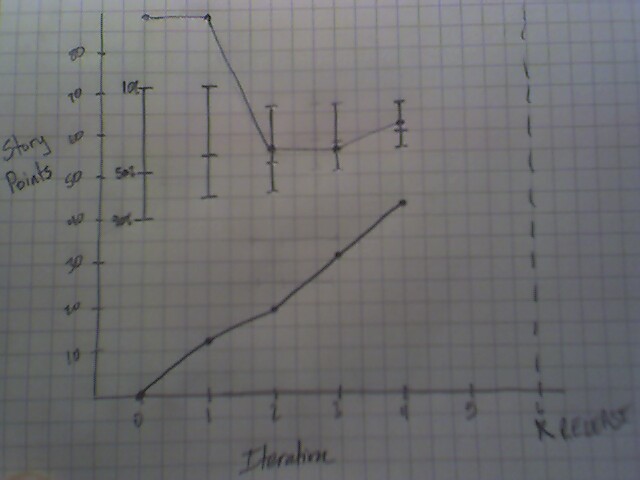
Iteration 1
The team signs up for 12 points and the iteration goes smoothly. They deliver 12 points. The customers leave the plan unchanged in hopes that the team's predictions are wrong. The team recalculates their risk-based projections:
- 10%: 72 (12 finished + 12 velocity × 5 iterations ÷ 1 risk)
- 50%: 55 (12 finished + 12 velocity × 5 iterations ÷ 1.4 risk)
- 90%: 45 (12 finished + 12 velocity × 5 iterations ÷ 1.8 risk)
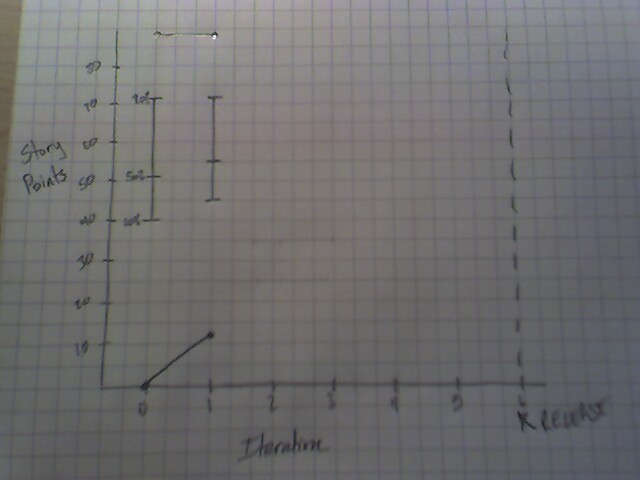
(The 10% and 90% should be reversed in this picture.)
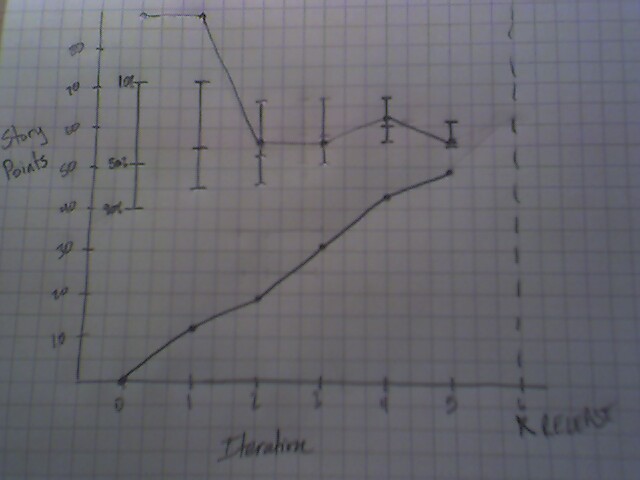
Iteration 2
It's a national holiday and most of the team is out for a few days this week. The team uses all of their slack but is unable to get everything done. They deliver 7 points, but they keep their projected velocity at 12, knowing that the holiday was an unusual event.
- 10%: 67 (19 finished + 12 velocity × 4 iterations ÷ 1 risk)
- 50%: 53 (19 finished + 12 velocity × 4 iterations ÷ 1.4 risk)
- 90%: 46 (19 finished + 12 velocity × 4 iterations ÷ 1.8 risk)
They report the news: "We are still committed to delivering features A and B, and feature C remains a reasonable stretch goal. Features E and F will definitely not be done and we're removing them from the plan."
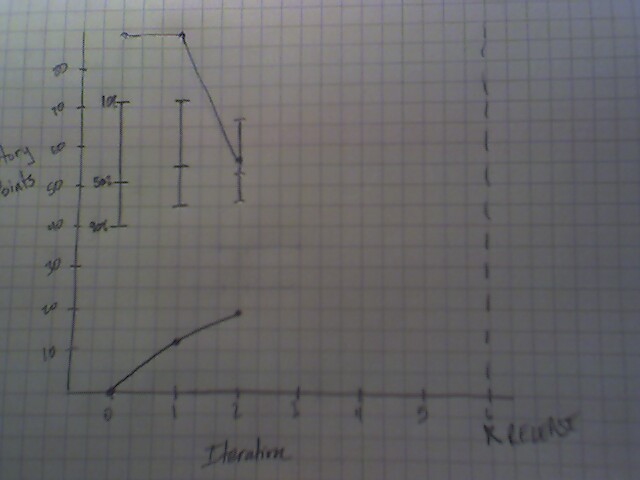
(The 10% and 90% are correct in this picture and all the remaining ones.)
Iteration 3 & 4
Iterations three and four proceed without incident and the team delivers all 12 points each time.
- 10%: 67 (43 finished + 12 velocity × 2 iterations ÷ 1 risk)
- 50%: 60 (43 finished + 12 velocity × 2 iterations ÷ 1.4 risk)
- 90%: 56 (43 finished + 12 velocity × 2 iterations ÷ 1.8 risk)
The team reports, "Great news! The work's been proceeding smoothly and we've finished features A and B. We're now working on features C and D, and we're adding feature E back in as a further stretch goal."
Iteration 5
Disaster strikes! A critical database crashes and everyone is pulled to work on it. The team only delivers 6 points this iteration.
- 10%: 61 (49 finished + 12 velocity × 1 iteration ÷ 1 risk)
- 50%: 56 (49 finished + 12 velocity × 1 iteration ÷ 1.4 risk)
- 90%: 55 (49 finished + 12 velocity × 1 iteration ÷ 1.8 risk)
The team's report: "Due to the unexpected problems this week, we're not going to get to feature E after all, and any problems on the scale of this week's will mean canceling feature D, too. However, we're committed to delivering feature C and we're going to do our best to get feature D done for you."
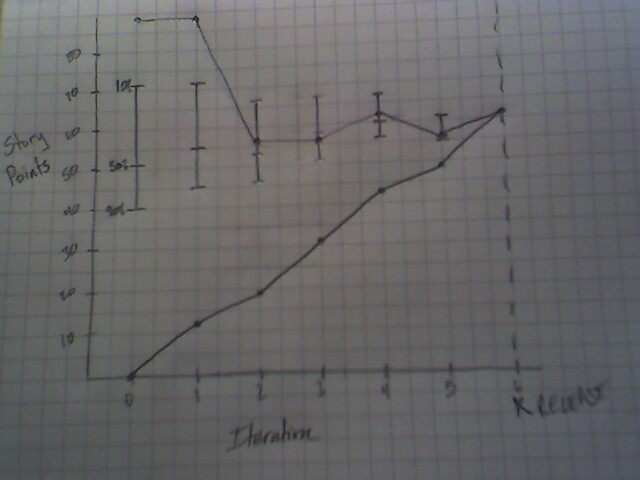
Iteration 6
No problems arise and the team gets all 12 points done, for a grand total of 61 points completed. They finish features C and D and spend the extra points adding polish to existing features and documenting their work. Rather than being upset that the team didn't get the whole plan done, stakeholders are happy that their expectations were exceeded. Everyone gets a big raise and they all live happily ever after.
The end.
PS: One of the cool things about this technique is that it automatically accounts for Steve McConnell's famous cone of uncertainty. Look at the risk bars over time and you'll see how they become smaller and more certain as time progresses, just as McConnell predicts.
Further Reading
Estimate Inflation: A Cautionary Tale. A follow-up example that shows what not to do.