

How Rabu's Schedule Projections Work
April 12, 2011
Team Rabu's first target is product scheduling. It's important to customers and it's easy for Agile teams to do well. A lovely combination.
The hard part is doing it in a way that customers love. That will take some trial and error, and we'll need your help conducting those experiments. The easy part is making schedule projections. That's what I'm going to talk about today.
Basic Projections
If you're using a typical Agile process based on Scrum or XP, you have everything you need to make schedule projections:
With these in place, a basic (but naïve) projection is easy. Your velocity represents how much you can get done each iteration, your estimated backlog tells you how much you need to do, and your iteration length tells you how much calendar time it will take. Like this:
Days Left = (Estimates ÷ Velocity) × Iteration Length
(This formula assumes you're performing the calculation at the beginning of an iteration.)
For example, if you have 100 points of stories in your backlog, your velocity is 10, and your iteration length is seven days, then you will be done in (100 ÷ 10) × 7 = 70 days.
It's Not That Simple
If you've ever tried the naïve approach, you know it doesn't work. Plans change; things go wrong.
The naïve projection is the best-case scenario projection. It assumes you will accomplish exactly the same amount of work every week, and that you will do exactly what's in your backlog.
Of course, that's not going to happen. In reality, there's a very good chance your team will discover new stories as you go. You will also have work disruptions such as illness and turnover. According to the data I've seen, projects will only meet their naïve projection 10% of the time. Most will take considerably longer.
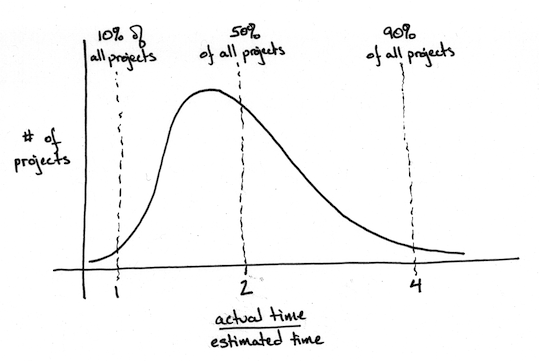
The above chart is typical. Of the projects described in this graph, only 10% were done before their naïve projection (the "estimated time"). The rest took longer than estimated, and half the projects took more than twice as long.
What's Your Risk?
Schedule projections are a forecast. Like a weather forecast, you have a range of possible outcomes. Some are more likely than others. A good projection is like the above graph--rather than showing a simple date, it shows a range of dates, each with an attached certainty.
| Time Remaining | Certainty |
|---|---|
| ≤ 70 days | 10% |
| ≤ 140 days | 50% |
| ≤ 280 days | 90% |
You can calculate these values by applying a risk multiplier to your projection, as follows:
Projectionrisk = (Estimates ÷ Velocity) × Iteration Length × Multiplierrisk
For best results, use multipliers based on your own historical results. In the absence of that data, I use Todd Little's data (for risky projects) and values calculated with DeMarco and Lister's Riskology simulator (for rigorous projects).
| Certainty | Rigorous Process | Risky Process |
|---|---|---|
| 10% | ×1 | ×1 |
| 50% | ×1.4 | ×2 |
| 90% | ×1.8 | ×4 |
A team that has a stable velocity, few defects, and meets its commitments every iteration gets to use the "rigorous" column. Everyone else should use the "risky" column.
The Hard Part
As I said in the introduction, making the projections is the easy part. A bit of arithmetic, that's all. The hard part is constructively sharing this information with customers. In my experience, raw projections tend to irritate more than help.
One approach I've seen work uses risk-adjusted burn-up charts. They're the kind of "powerful visual" I described in our vision. Here's an example. I'll describe it fully in another essay:
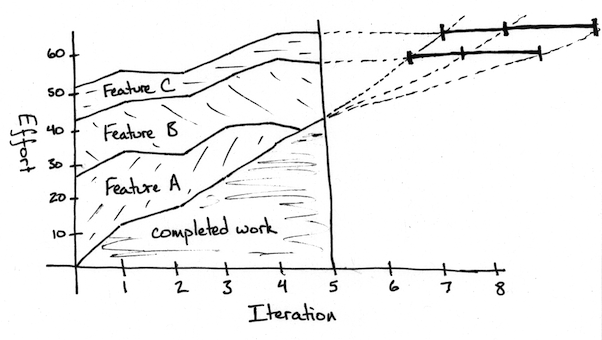
The raw projections combine with solid visualizations and the Rabu workflow to form the basis of Rabu's approach to schedule projections. We'll need to experiment to see what proposal formats work best for stakeholders, and Team Rabu is going to provide tools to make creating proposals more convenient, but you can start using these ideas today. All you need is a calculator and a willingness to experiment.