

Rabu Schedule Visualizations: Taking the Edge Off Hard Facts
April 25, 2011
Our customers want--need--to know what we're going to get done and when. As I described in my last Rabu essay, Agile teams have the ability to make those projections.
But they aren't always well-received. Most Agile teams I've met don't have the full trust of their key stakeholders, and schedule projections often aren't as rosy as those stakeholders would like. The stakeholders react by shooting the messenger.
We need to find a way to redirect stakeholders' frustration to a constructive discussion of the facts rather than an exercise in blaming the team. That's where Rabu visualizations come in. They attempt to present projection data in a way that focuses conversation on facts and options rather than blame.
Stakeholders' most common complaint is one we've all heard before: "Why will it take so long?" It's easy to interpret that question as an attack on the team's ability, especially when it's said in an angry tone of voice, but we can also create a more positive discussion by focusing on two underlying questions:
- What are you going to work on during that time?
- Is this estimate realistic?
What are you going to work on?
If you have an estimated story backlog, you can answer the question of what you're going to work on very easily: you're going to work on what's in your backlog.
You shouldn't just shove a list of stories at your stakeholders, however. That's a lot to absorb at once, and that risks making your stakeholders feel foolish, which will only increase tension. Instead, roll up the list of stories into three to seven major items. Perhaps they're minimum marketable features (MMFs); perhaps they're just groups of stories. Either way, the goal is to distill your backlog down to its essence.
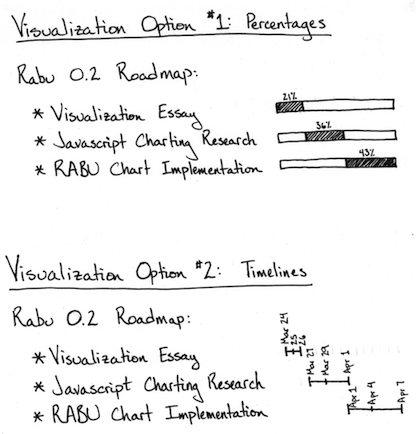
For example, for the upcoming Rabu 0.2 release (going out to early adopters in early May), we have ten stories in our backlog. They're things like "Spike Raphael graphing library" and "Gracefully handle fall-back when there's insufficient historical data." In conversations with stakeholders, however, we roll that list up into three bullet points, like this:
- Rabu 0.2: Add risk-adjusted burn-up chart
- Visualization essay
- Javascript charting research
- RABU chart implementation
Given a simplified list of features, you can help focus the conversation further by providing a visualization of the work involved for each one. The diagram below shows two options we're considering for Rabu. Option #1 shows the relative size of each feature; Option #2 shows miniature timelines.
From the outside, programming work always looks easier than it really is. Providing detail about what you're working on and how long it takes will help stakeholders understand why there's so much work involved.
Is this estimate realistic?
Even when your stakeholders understand what you're working on, they're likely to think that your projections are overblown. We need to help stakeholders trust our estimates, and a technique I've found valuable is to show a consistent history of realistic projections by using a risk-adjusted burn-up chart.
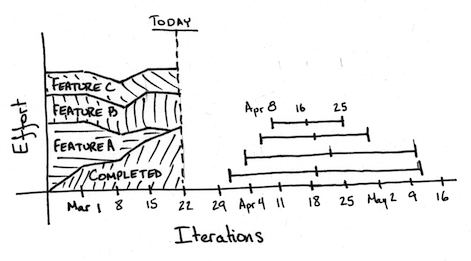
On the left, the chart shows the cumulative work required to complete each feature. Time passes as you move from left to right and the total work completed grows. By March 22nd ("today" in this example), there's no work remaining for Feature A.
On the right, the visualization shows your historical projections as miniature timelines. They roughly correspond with the height of the "completed" line, so the highest projection is the most current. You can see that the projections are consistent and narrowing in on a mid-April delivery date.
This is a complicated chart, but I've had success with it. The "completed" line helps stakeholders see that you're making steady progress; the stacked "features" areas show when delays are the result of scope creep; and the historical projections show that your projections are reliable and becoming more precise over time.
Perhaps most importantly, this chart demonstrates to your stakeholders that you're not just pulling your schedule projections out of mid-air. Even if they don't understand the chart, they'll appreciate the sophistication of your projection techniques, especially as they see the chart evolve over time.
No Silver Bullets
When stakeholders shoot the messenger, the root cause is lack of trust, and no visualization is going to magically solve that problem. The goal here is to redirect stakeholders' frustration into a discussion of data. In some cases, the rift between a team and their stakeholders may be too large to overcome. For most teams, though, frequent positive communication and a history of making and meeting commitments will do wonders.
I'd like to hear from you. What have you done to get your customers to love you? How do you share scheduling information with your customers? Share your experiences in the comments.