

Are You Getting Your Money’s Worth from AI?
September 8, 2026
Software development has emerged as the biggest beneficiary of AI automation. One CIO I talked to recently, with 170 people in his organization, measured a 2.1x increase in productivity from AI.
That productivity came at a cost. His top users of AI each spent $21,000 on tokens per month. Another engineering leader spends six to eight thousand dollars per engineer per month.
This is a non-trivial amount of money. Eventually, it has to come from somewhere, and it will probably come from your personnel budget. Now we’re talking about real consequences for real people’s lives. But there are real business consequences for not acting, too.
If you’re going to make those choices—and somebody is going to—they need to be good ones. That means you need to know more than the costs. You need to know the benefits, too. Are you getting a good return on your investment in AI? Is there another way of using AI that would be better?
Which raises the question: how do you know what you’re getting? Anecdotal reports abound, but the reasoning behind those anecdotes are often, to put it politely, not ideal. Some claims are outright fiction.
Given the stakes, that’s a problem.
In this essay series, I’ll show you how to assess the impact of AI on software development in your organization. It’s in four parts plus an epilogue:
- Why, and what not to do (this essay)
- Measuring delivery speed
- Measuring and modeling unintended consequences
- Modeling and forecasting business outcomes
- Epilogue: Notes for your CFO
Why You Need to Quantify Impact
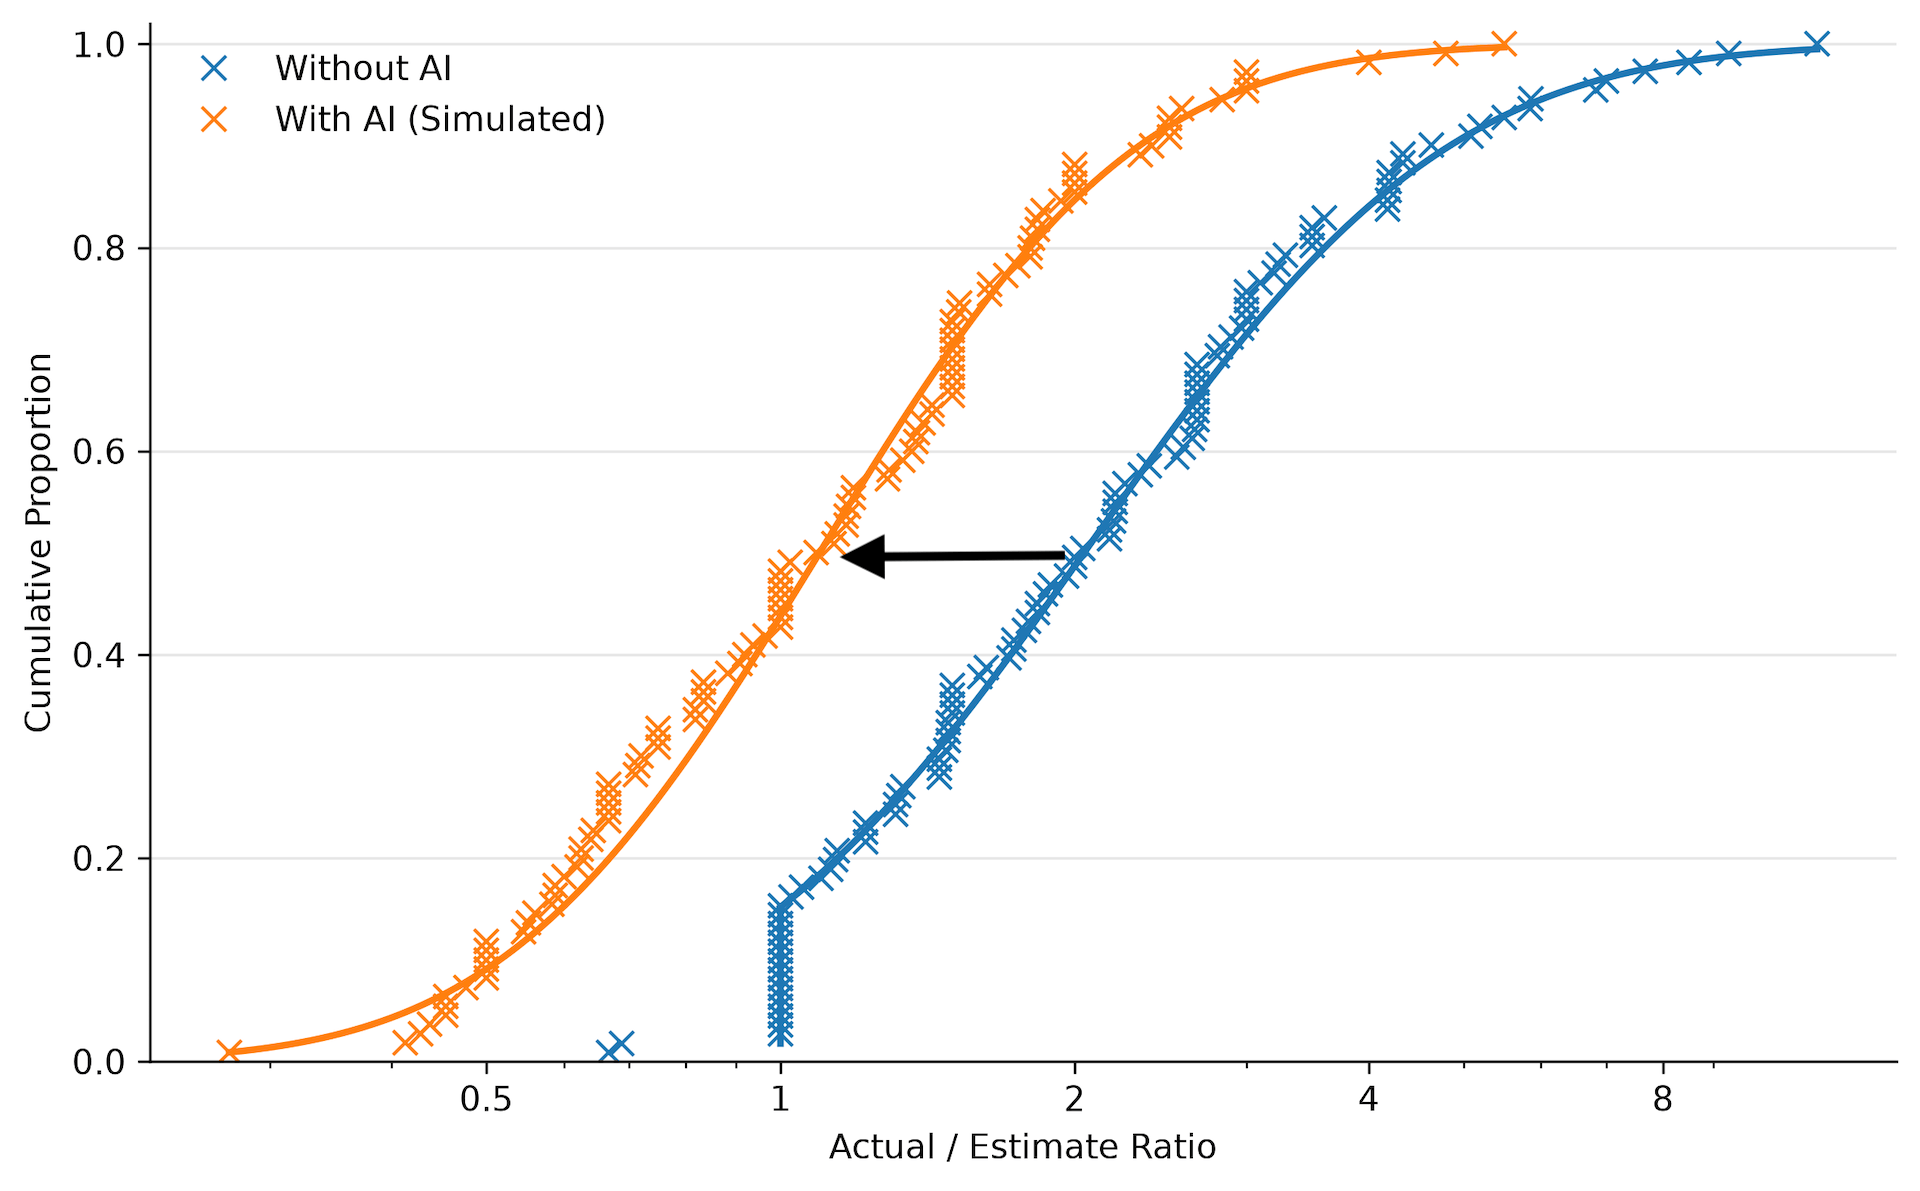
Engineering leaders everywhere are feeling pressure to do more with AI. But which approach is best? There are a lot of people with strident opinions about what to do, but not a lot of consensus, and even less hard data.
Even if there was hard data, it’s not one-size-fits-all. A solution that works best for an internal IT development shop isn’t necessarily the one that works best for a startup, and the approach that’s best for a new product isn’t necessarily the one that’s best for a crufty legacy system.
Faster approaches aren’t necessarily better, either. If you get twice as much done per person, but spend so much money on tokens that you have to cut your staff in half, have you actually seen any ROI? You might actually be better off with a more modest speed boost if it keeps your costs down.
You can’t make these tradeoffs from gut feel alone. In a famous METR study, engineers thought AI made them 49% faster than it actually did.1 You have to measure impact to know what you’re actually getting.
1Participants rated themselves as 20% faster, but were measured as being 19% slower. This study was published prior to the big uplift in coding capability that started with Anthropic’s Opus 4.5, so you shouldn’t take it to mean that AI isn’t capable. But you should take it to mean that productivity self-assessments aren’t the way to go.
Don’t Neglect Costs
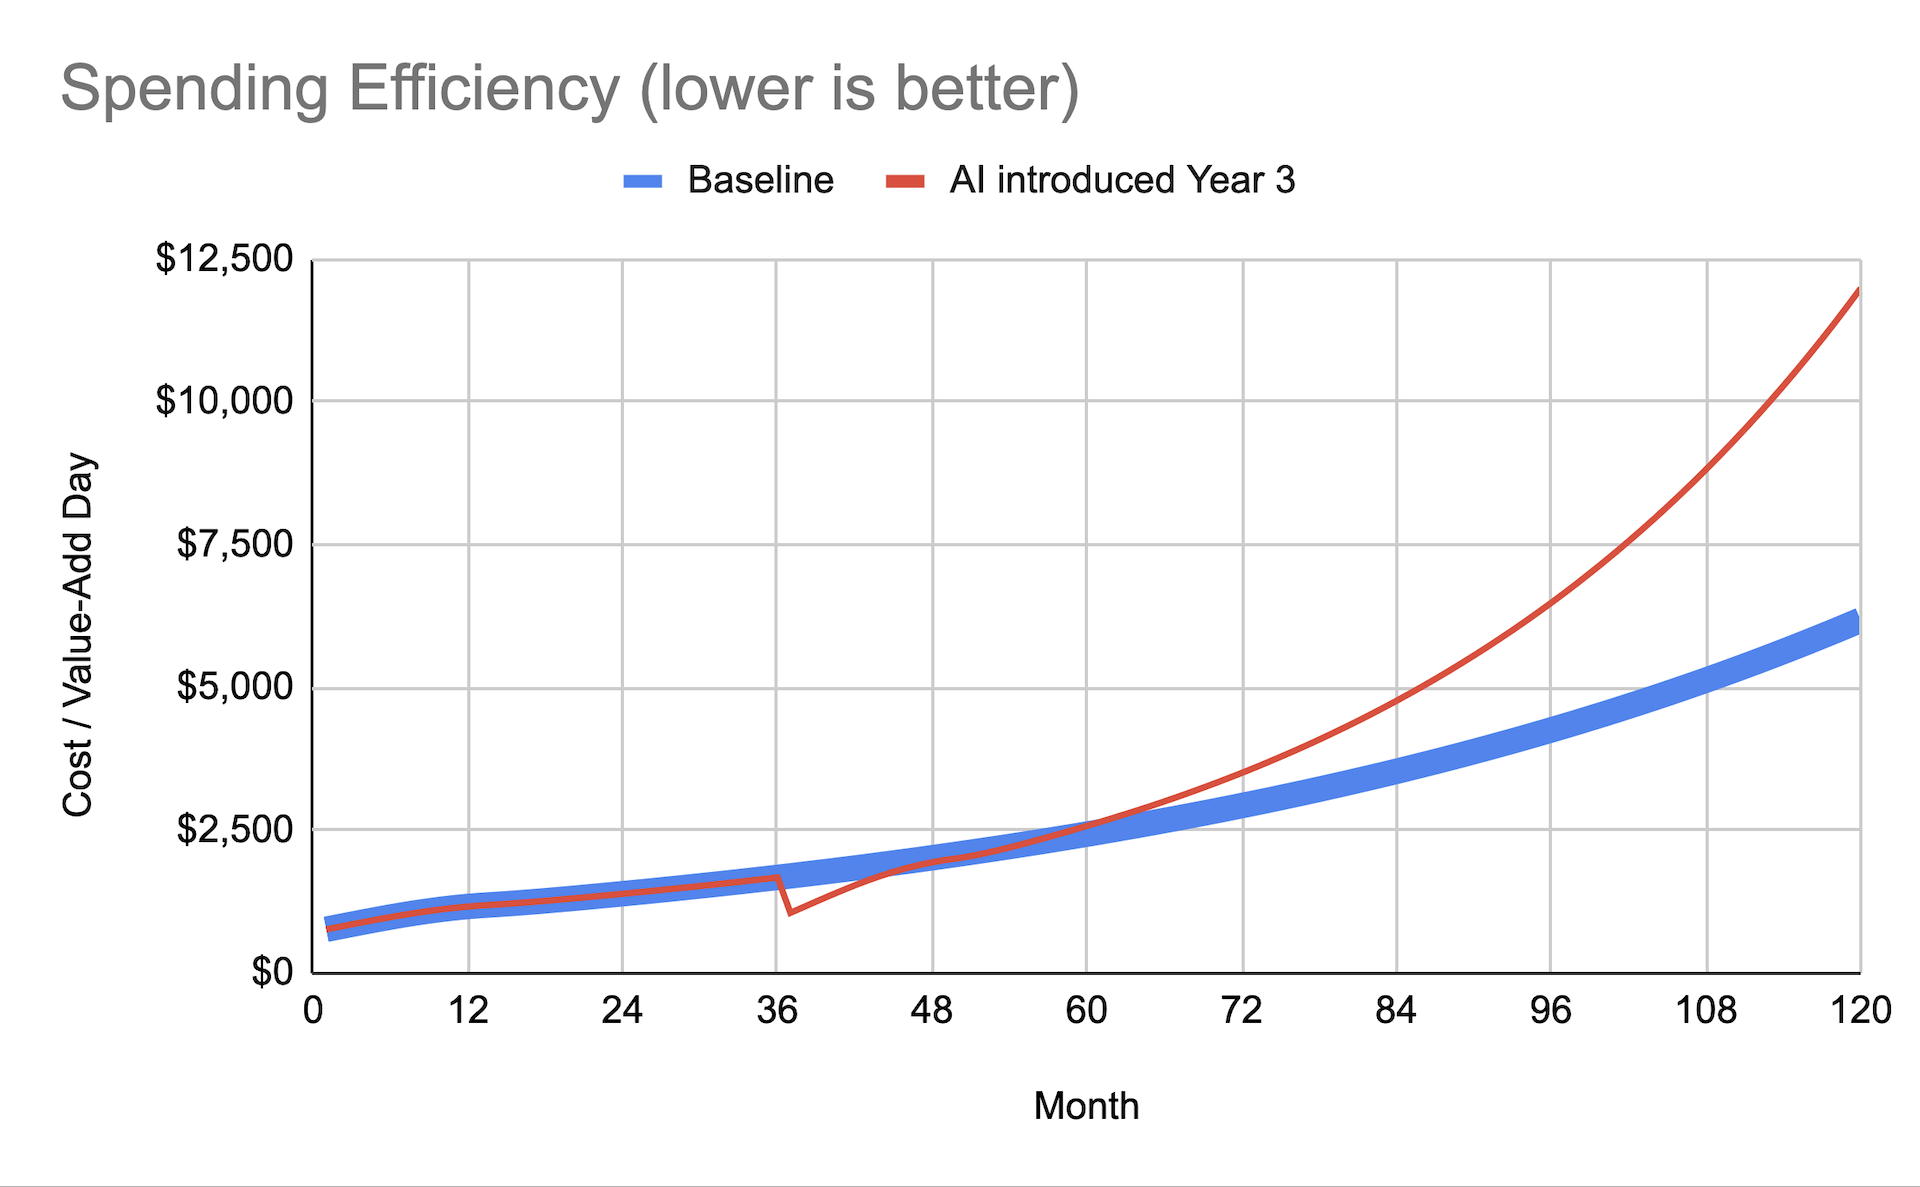
Costs are much easier to measure than impact, but they’re not without their own challenges. The biggest one is subsidies. In the fight to gain market share, big AI firms are offering substantial discounts. One engineering leader told me each team member was spending thousands of dollars in tokens at the cost of a $200 subscription. Anthropic and OpenAI are constantly offering discounts and other promotions. At some point, these subsidies will end, and prices will go up.
Or will they? Open-weight models and local inference are exerting downward pressure on token costs. Dedicated inference chips could make tokens cheaper. Routers promise to direct your prompts to the cheapest model for the job. Models could require fewer tokens to accomplish the same task as they become more capable. All of these factors could actually cause prices to go down.
When you calculate ROI, don’t assume today’s costs are the ones you should model. Whether you think prices will go up, down, or remain the same, make your assumptions explicit, and consider modeling both optimistic and pessimistic scenarios.
One more wrinkle: adopting AI isn’t a matter of flipping a switch. People will need time to learn how to apply it. As with any big shift, change management isn’t to be underestimated. Productivity often goes down, during a big change, before it goes up. This adds costs, too, and means early measurements can be misleading.
Thinking for the Long Term
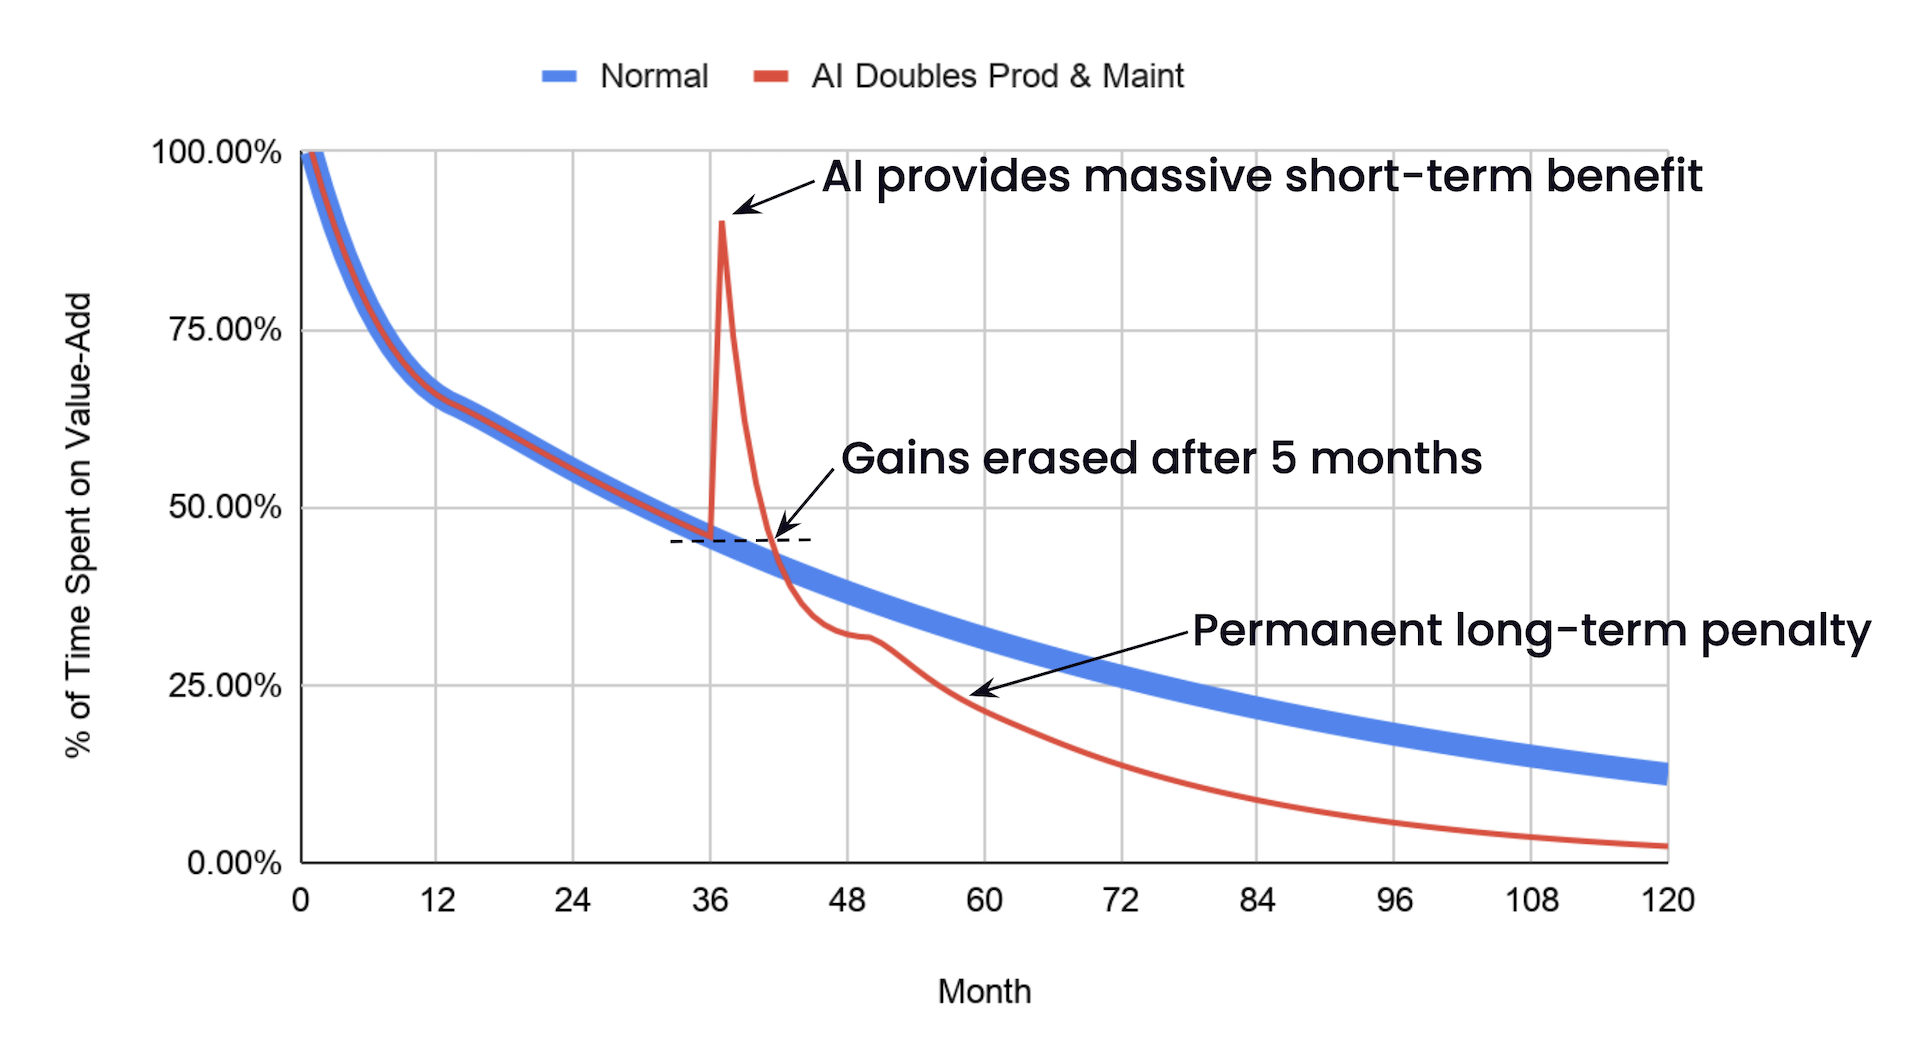
Part 2 of this series shows how to measure delivery speed. That’s only part of the picture. If you produce twice as many features, but double your maintenance costs, your team’s overall productivity spikes, then drops like a rock.
Engineer burnout is a concern, too. An engineering leader using spec-driven development told me, “every team is reporting burnout.” I’ll state the obvious: burned out people don’t produce great work. They don’t push back when they should, they don’t report problems, and eventually, they leave, taking valuable institutional knowledge with them.
Part 3 shows how to measure these unintended consequences of AI use, including techniques you can use to forecast future problems.
And finally, it’s not about delivering software faster. It’s about delivering value faster. Doubling your bug-fix rate isn’t going to yield the same results as doubling your rate of competitive new features. For that matter, delivering poorly thought-out features “just because we can” could actually make your product worse.
Part 4 shows how to model, forecast, and measure business outcomes.
Don’t Measure Lines of Code
But first, what not to do. It’s pretty straightforward: Don't take the easy way out.
First on the no-go list: lines of code. Engineering leaders have known for years... decades... more than half a century that lines of code don’t correspond to productivity. All else being equal, a feature implemented in 1,000 lines of code will be cheaper to maintain and less bug-prone than a feature implemented in 10,000 lines of code.
AI is notorious for its verbosity. If you measure lines of code, you’re not measuring productivity. You’re measuring slop. Don’t do that. Please.
Don’t Measure Pull Requests Either
Pull requests (PRs) are nearly as bad. They’re checkpoints where an engineer asks for their code to be reviewed, and they’re 100% arbitrary. An engineer (or AI) can choose to make a ten-line pull request or a ten-thousand-line pull request. It can be a feature, a bug fix, or just a tiny code improvement. There’s no inherent correlation between number of pull requests and productivity.
It’s true that engineers will generally produce PRs that are consistent and logical. So, in a sense, a stream of PRs does reflect a certain pace of development, and, all else being equal, an increase in PRs can reflect an increase in productivity.
But AI upends that status quo. It produces massive amounts of code very quickly, which can overwhelm engineers’ ability to keep up. Without rigorous engineer oversight, PRs no longer reflect a consistent pace of development, which means that PR counts are no longer a reliable metric.
And, of course, when people think PRs are being used to measure productivity, they’ll be tempted to game the system, and produce more PRs than they really need to.
Measure Approaches, Not People
That brings us to Goodhart’s Law. “Once a measure becomes a target, it ceases to be a good measure.” My favorite book on this topic is Robert D. Austin’s Measuring and Managing Performance in Organizations:
Gradually, measures fall (or, more accurately, are pushed) out of synchronization with true performance, as workers succumb to pressures to take shortcuts. Measured performance trends upward; true performance declines sharply. In this way, the measurement system becomes dysfunctional.
—Robert D. Austin
Don’t establish a performance measurement program and leave it running. Instead, use these metrics to to determine how well a particular approach to AI is working. You can repeat the measurements periodically, but whatever you do, don’t use them to measure the performance of teams or individuals. Measure the approach. Learn from it. And stop measuring.
Enough about what not to do. In this series, we’re going to quantify AI’s impact, and we’re going to do it right. It starts with measuring delivery speed. That’s next, in part 2.